The number of confirmed applicants for the 2024 university entrance common test has been announced. Due to the decrease in the 18-year-old population, the number is down 96% compared to the previous year.The published materials list the number of applicants by exam location (prefecture) and the number of applicants by birthplace (prefecture), and include new high school graduates (current students), high school graduates, etc. You can check the number of applicants by gender (already graduated) and by gender.Looking at the number of applicants by region of birth and gender, it can be seen that the number of women in metropolitan areas has declined more slowly than the number of men.

The number of confirmed applicants is decreasing for both current and graduated applicants.
The University Admissions Center announced on December 12th the number of confirmed applicants for the 2024 University Entrance Common Test (hereinafter referred to as the "Common Test").According to this, the number of people decreased by 96% from the previous year, or about 45.2 people.Although the number of current graduates is decreasing due to the relaxation of the weighting factor and the tendency to make university entrance exams easier, the number of confirmed applicants for the common test is also decreasing among current students.However, the percentage of students expected to graduate from high school who applied for the common test (current student application rate) was XNUMX%, the highest ever.Since it became a common test, and the question trends were different from the previous National Center Test for University Admissions, it was pointed out that private university applicants were turning away from the common test, but the application rate among current students was increasing.For detailed analysis and comparisons with past data, please see the detailed article on Kei-Net Plus, Kawaijuku's information site for educators (link below).
Looking back at the trends in the number of applicants, <Graph 2014> is a graph showing the trends in the number of applicants by gender since the National Center Test for University Admissions (hereinafter referred to as the National Center Test).Currently, on the University Admissions Center website, data can be traced back to XNUMX, but this graph was created by adding data on the total number of applicants (by gender) that I had personally recorded before then.
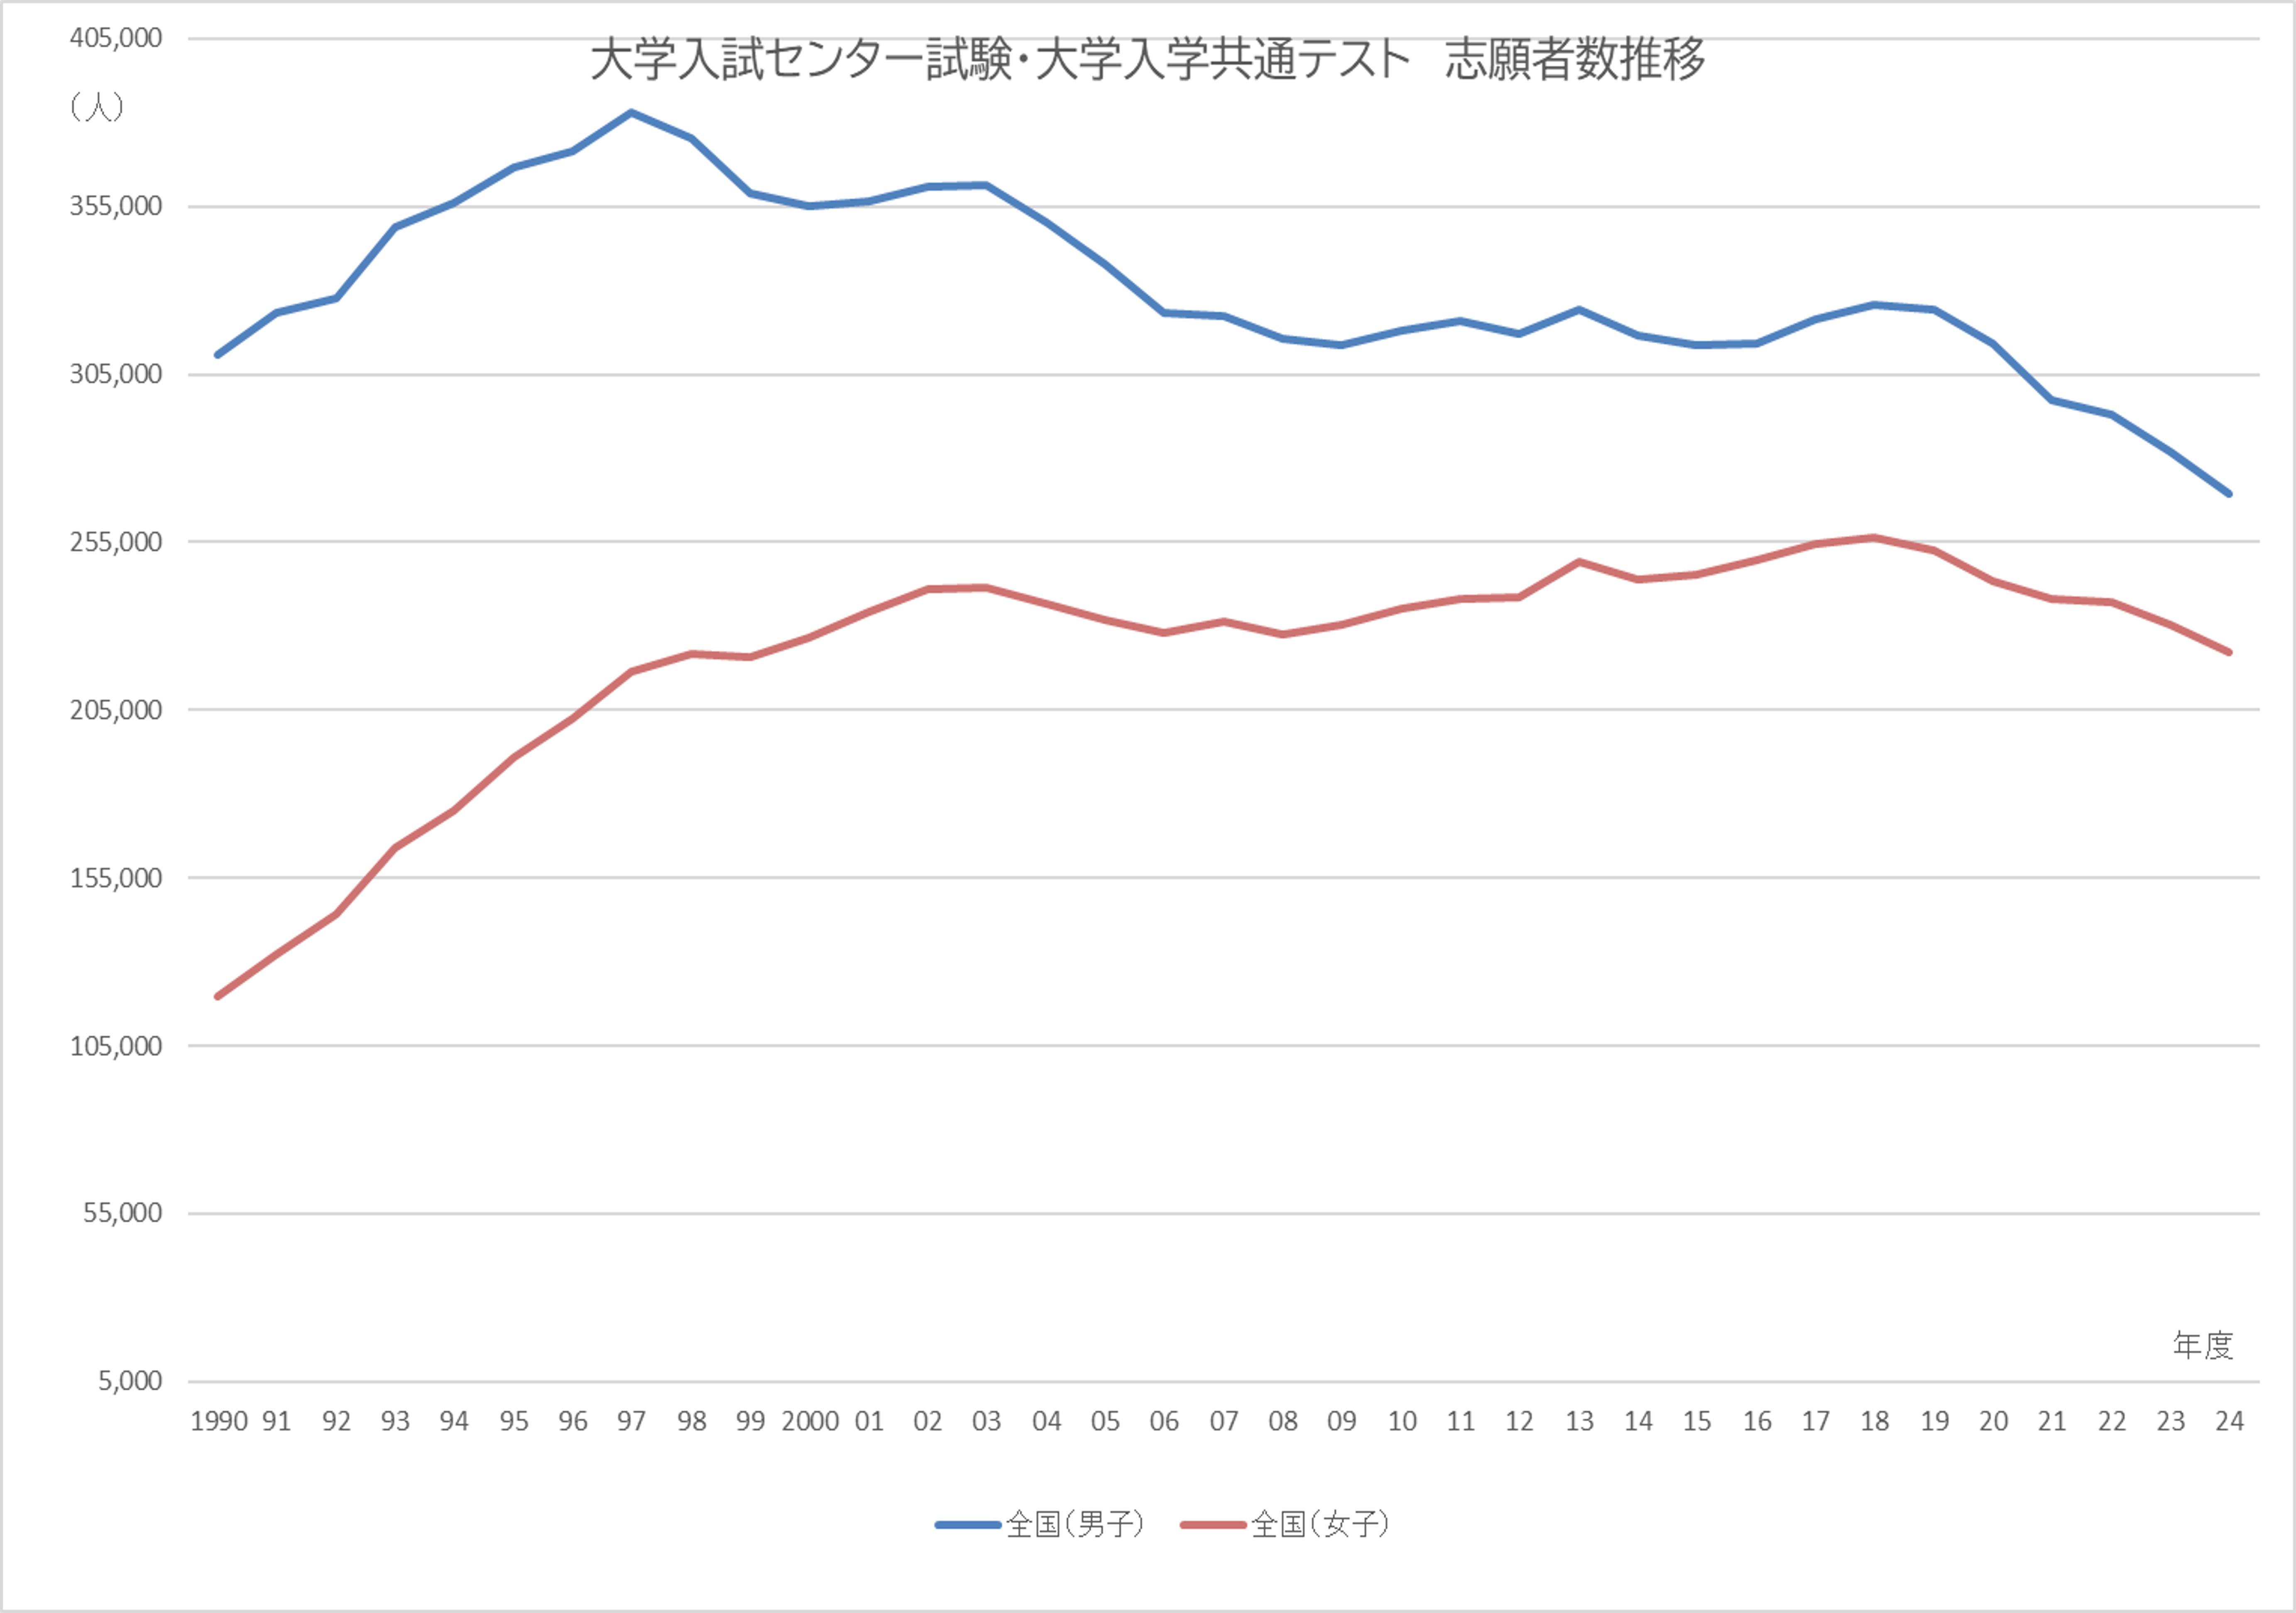
Looking at this graph, you can see that the number of female applicants has rapidly increased since 1990, when the Common Primary Examination was changed to the National Center Test.Although it has been on the decline for the past three to four years, the gender gap has narrowed significantly compared to the 90s.According to an article on Kawaijuku's university entrance examination information site, Kei-Net, ``2024 Entrance Examination Overview'', there has been a noticeable change in the career aspirations of women in terms of application trends by faculty system, with women pursuing careers in fields other than those traditionally interested in law, science and engineering, etc. He explains that it is distinctive that women are entering fields where the female share is extremely low.As shown in the graph, the fact that the gender gap in the number of university applicants is disappearing means that there is a change in the preferences of prospective students in choosing their undergraduate schools, although this may seem a little late.From the perspective of corporate management, all that is needed is for universities to respond to changes, but universities may be able to establish new departments in response to changes in the environment, but they may not be able to maintain existing departments. The reality is that it is extremely difficult to reform or abolish a company, and it cannot be done unless management is forced to do so (although now may be the time).
Kei-Net Plus, an information site for Kawaijuku educators
https://www.keinet.ne.jp/teacher/
University Entrance Examination Center “Past National Center Test Information”
https://www.dnc.ac.jp/kyotsu/kako_shiken_jouhou/kako_centershiken_jouhou/
Kawaijuku's university entrance examination information site Kei-Net "Summary of the 2024 entrance examination"
https://www.keinet.ne.jp/exam/future/
Prefectures with large cities are seeing a slow decline in numbers.
The graph below shows the number of applicants by gender by hometown (location of high school, etc.) from 2014, which is the latest available, to 2024, based on the University Entrance Examination Center data mentioned above. XNUMX>.Graph XNUMX shows prefectures with large cities with large populations: Tokyo, Kanagawa, Osaka, and Aichi.Even though there are large cities with large populations, the number of applicants is still on the decline, but the slope of the graph is becoming more gradual.

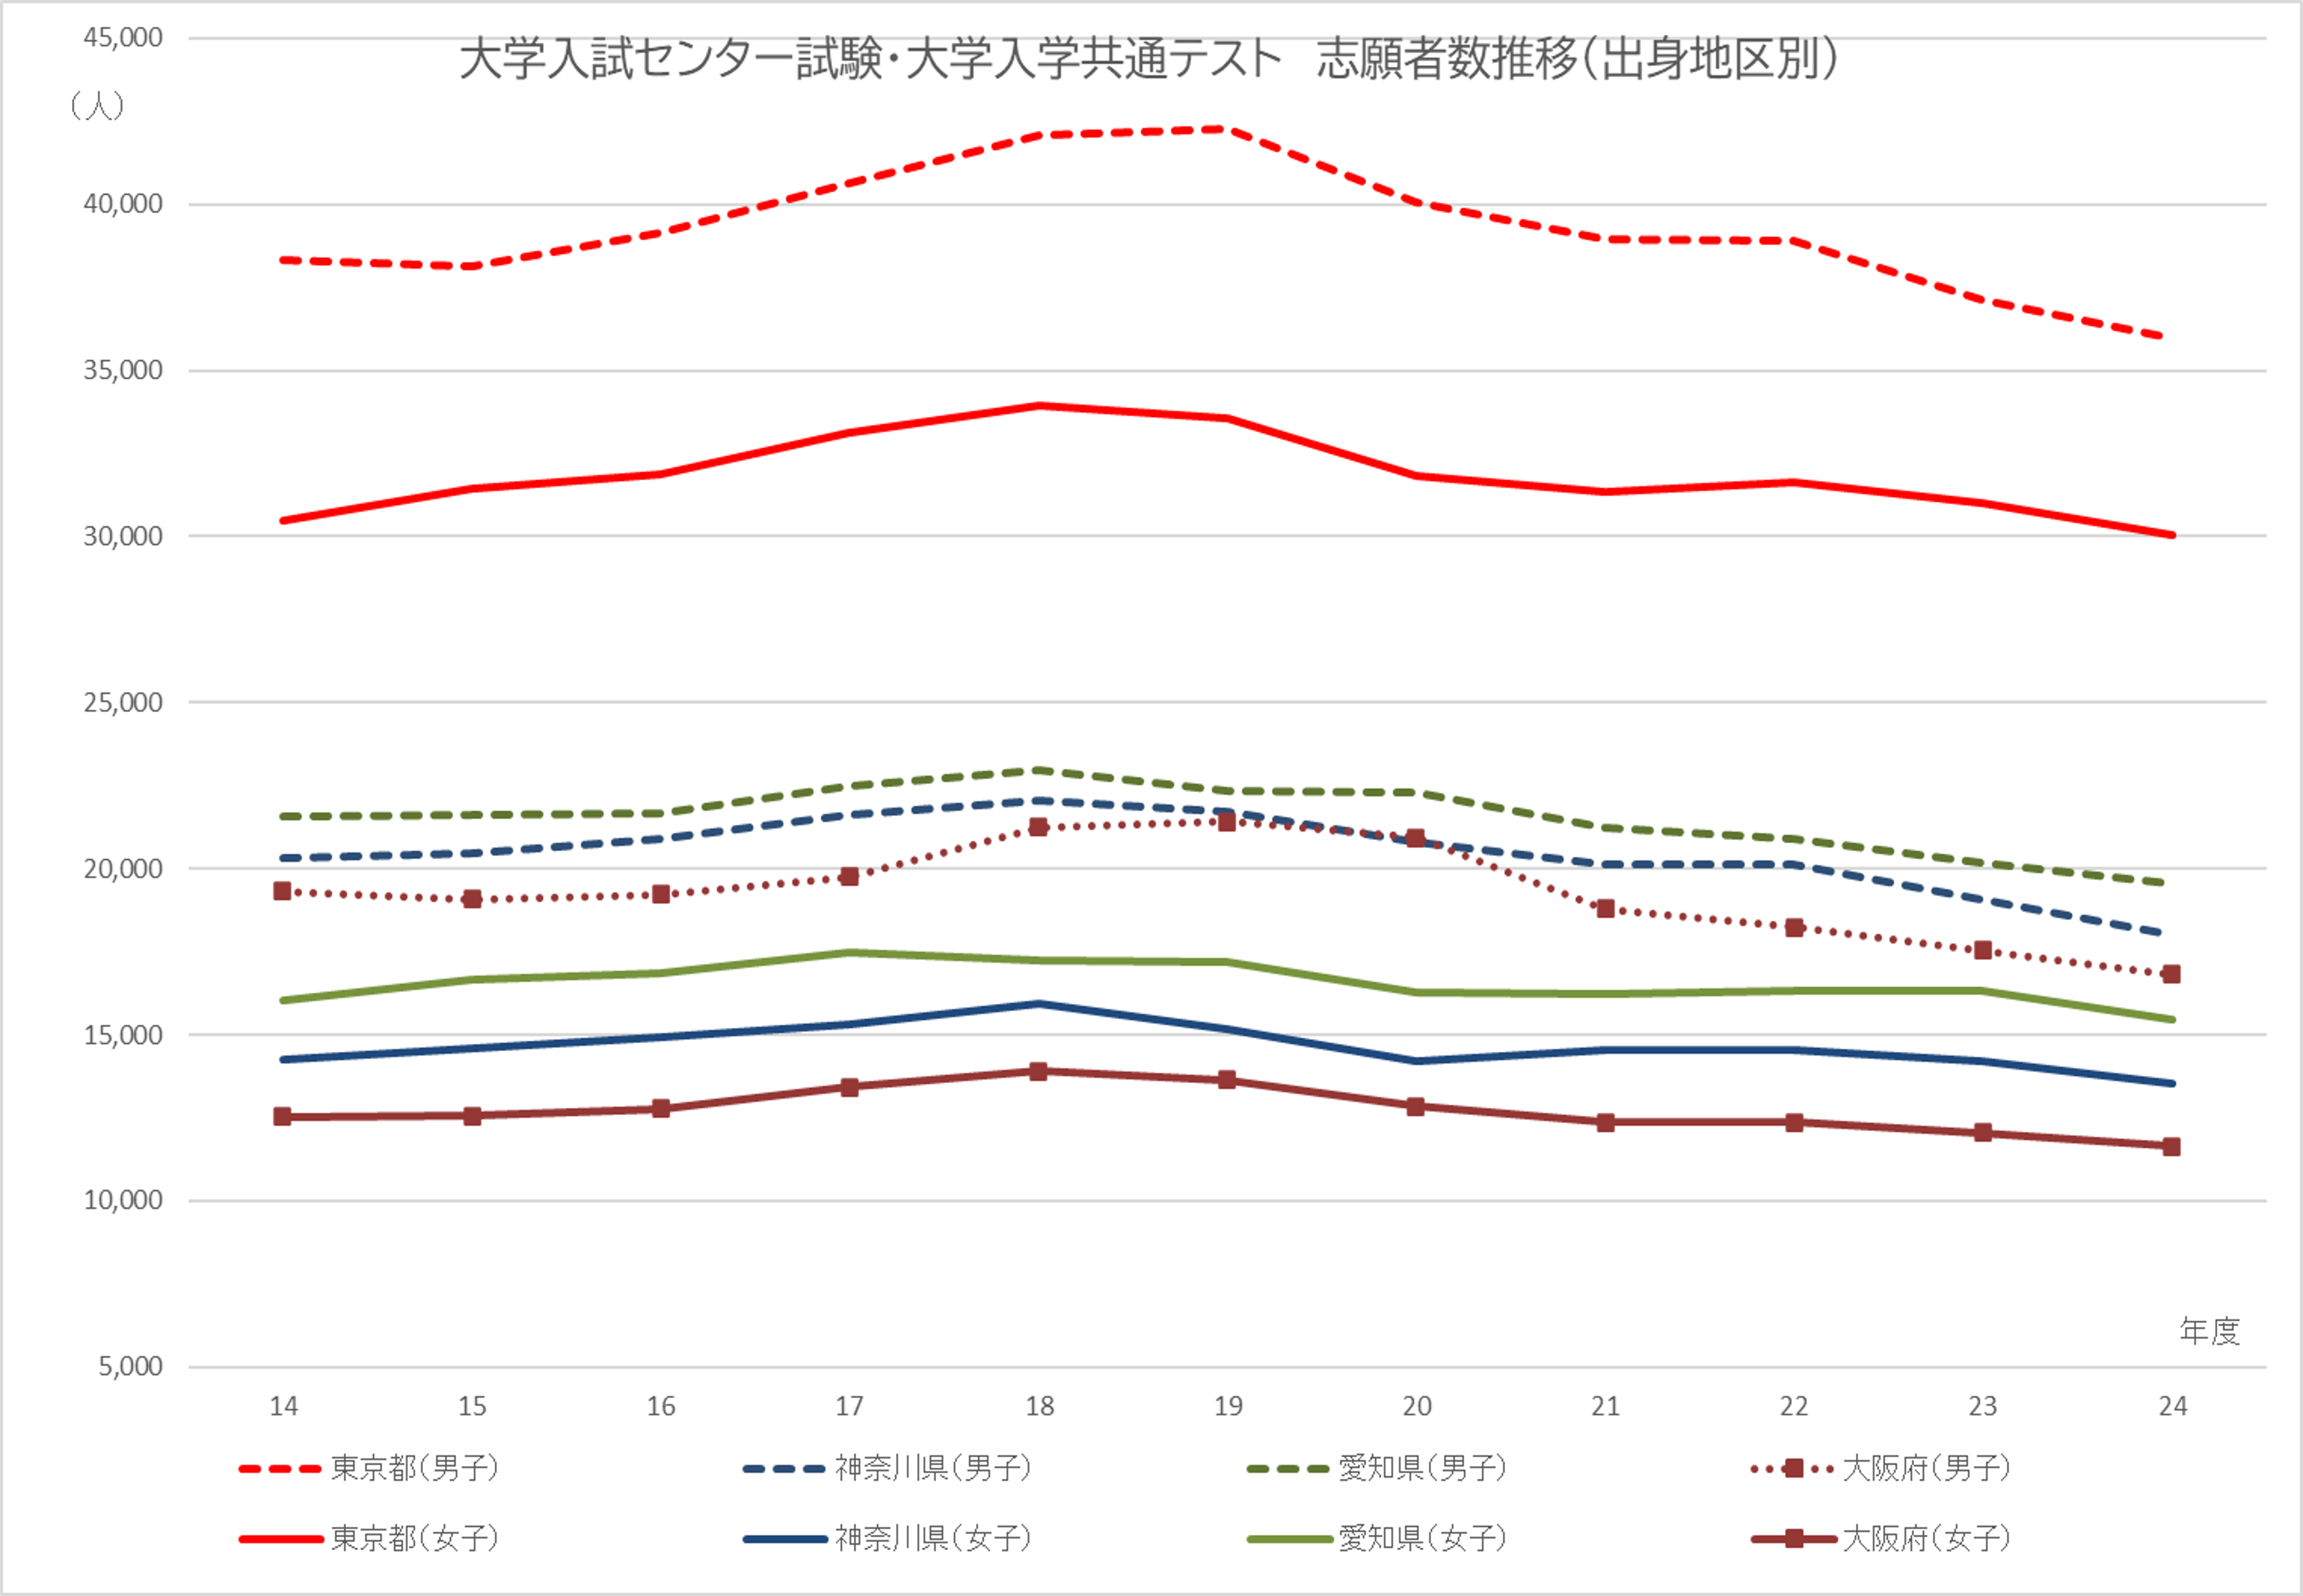
However, looking at Graph 2021, the number of male applicants for the common test in Osaka Prefecture, which exceeds Kanagawa and Aichi prefectures in terms of the number of high school students, has begun to decline from around XNUMX. It is lower than Aichi prefecture.In the previous section, we touched on the shift away from the common test among private university applicants, but it is difficult to tell from this data alone whether the trend is more pronounced in Osaka Prefecture.
In the Kawaijuku ``Summary of 2024 Entrance Examination'' article mentioned above, the increase rate of applicants to the difficult university group using the common test is high, and the common test is being used as an entrance exam method for applicants to national and public universities. It mentions the possibility that it is considering a usage method.This will probably happen in difficult large groups.However, the following numbers suggest that the number of applicants will decrease significantly when medium-sized private universities in the Kinki area adopt a common test system, which will be a positive trend for examinees.
Furthermore, looking at trends in the number of female applicants, the slope of the graph is more gradual than the number of male applicants in Kanagawa, Aichi, and Osaka prefectures, and the downward trend is gradual.The recruitment category for female applicants in science and engineering departments at national universities, the so-called female quota, is expanding, but this policy is logical as it is linked to trends in the number of female applicants.The current applicant rate is as high as 53.7% in Aichi Prefecture, where applicants for university admission = applicants for the common test, but in some places it is even higher at 58.0% in Tokyo and 56.0% in Hiroshima Prefecture (36.8% in Osaka Prefecture). , Kyoto Prefecture 36.5%).
Status of the number of applicants in areas close to large metropolitan areas
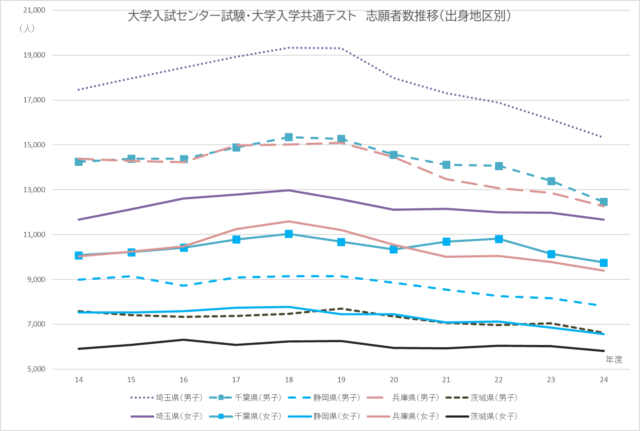
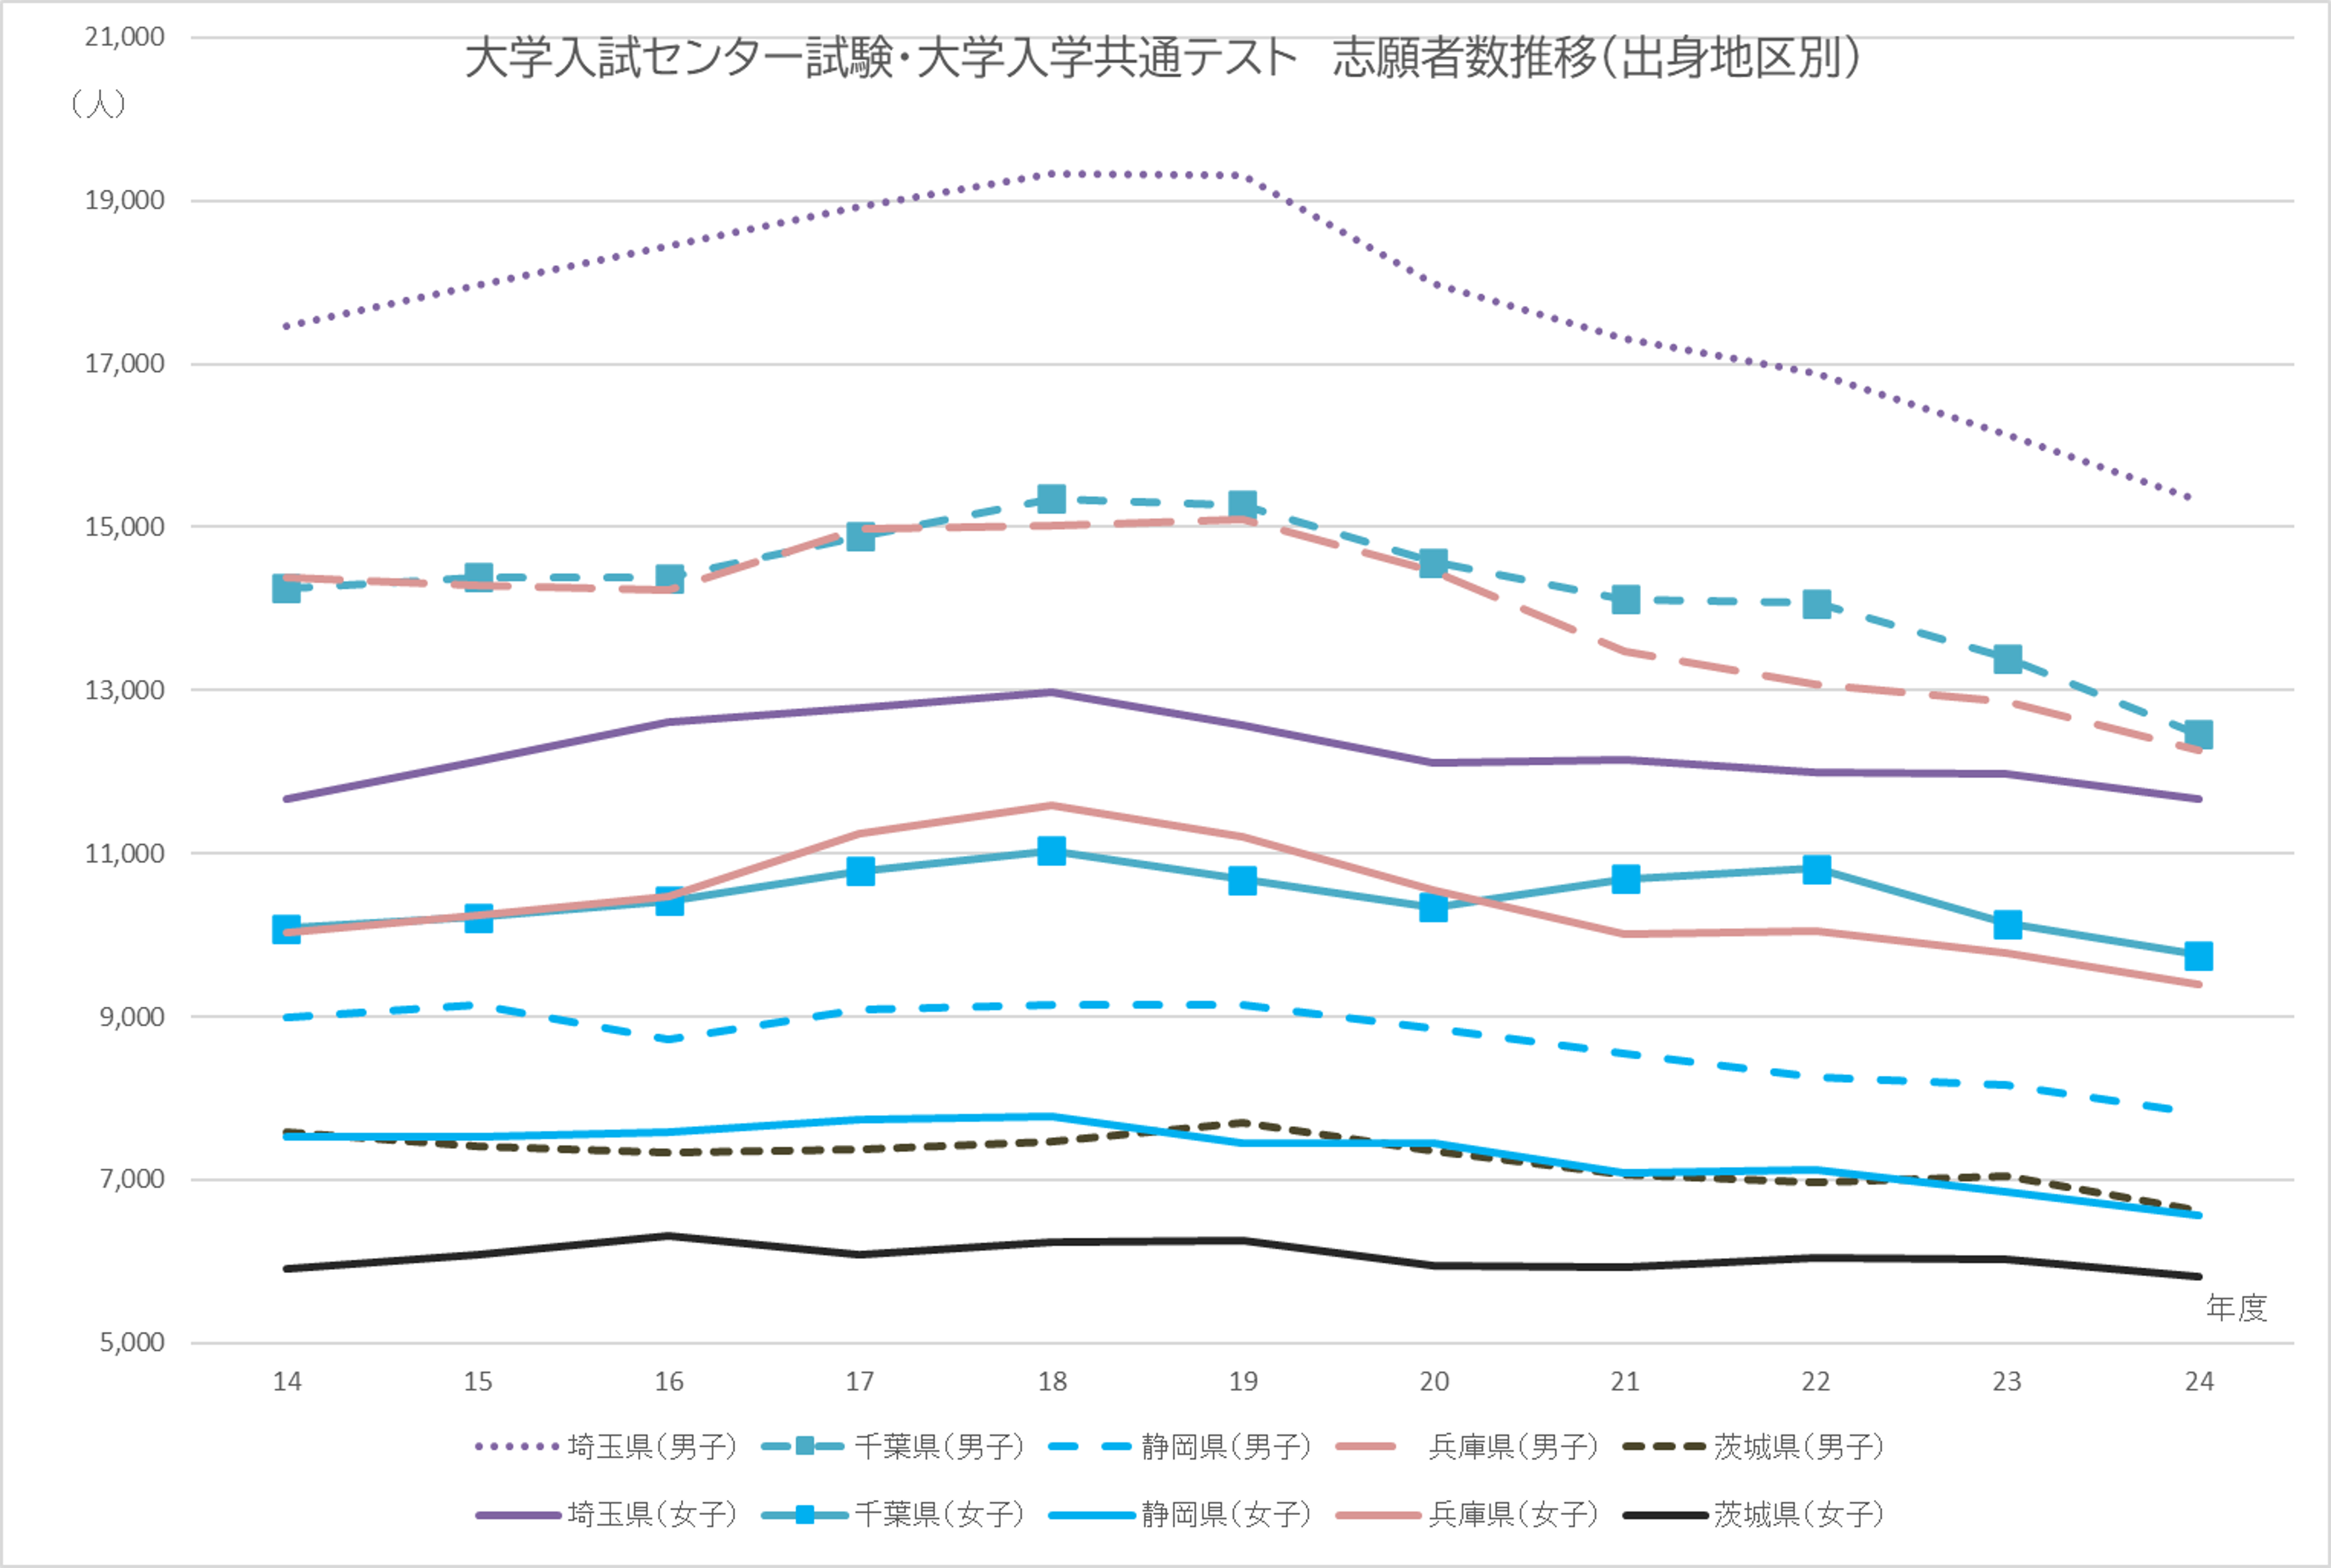
<Graph 2020> is a graph showing the situation in prefectures that are close to the prefecture where the large city mentioned in the previous section is located.Graph XNUMX shows the trends in the number of applicants in Saitama, Chiba, Shizuoka, Hyogo, and Ibaraki prefectures.The number of male applicants has decreased significantly in Saitama, Chiba, and Hyogo prefectures since around XNUMX.In comparison, the number of female applicants in Saitama, Chiba, and Hyogo prefectures has not decreased much.This is an interesting result from a marketability perspective.Similarly, there appears to be little change in the number of female applicants in Ibaraki Prefecture.
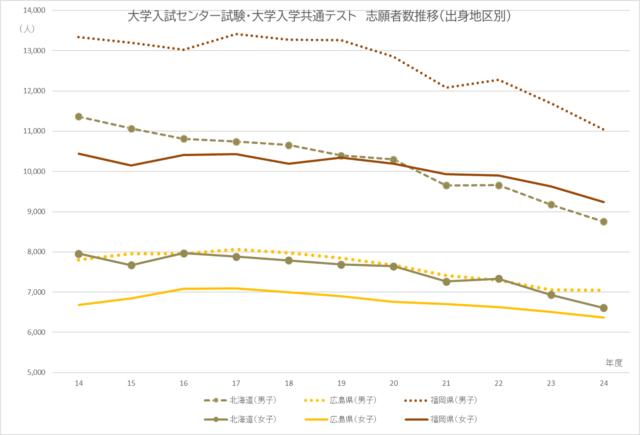
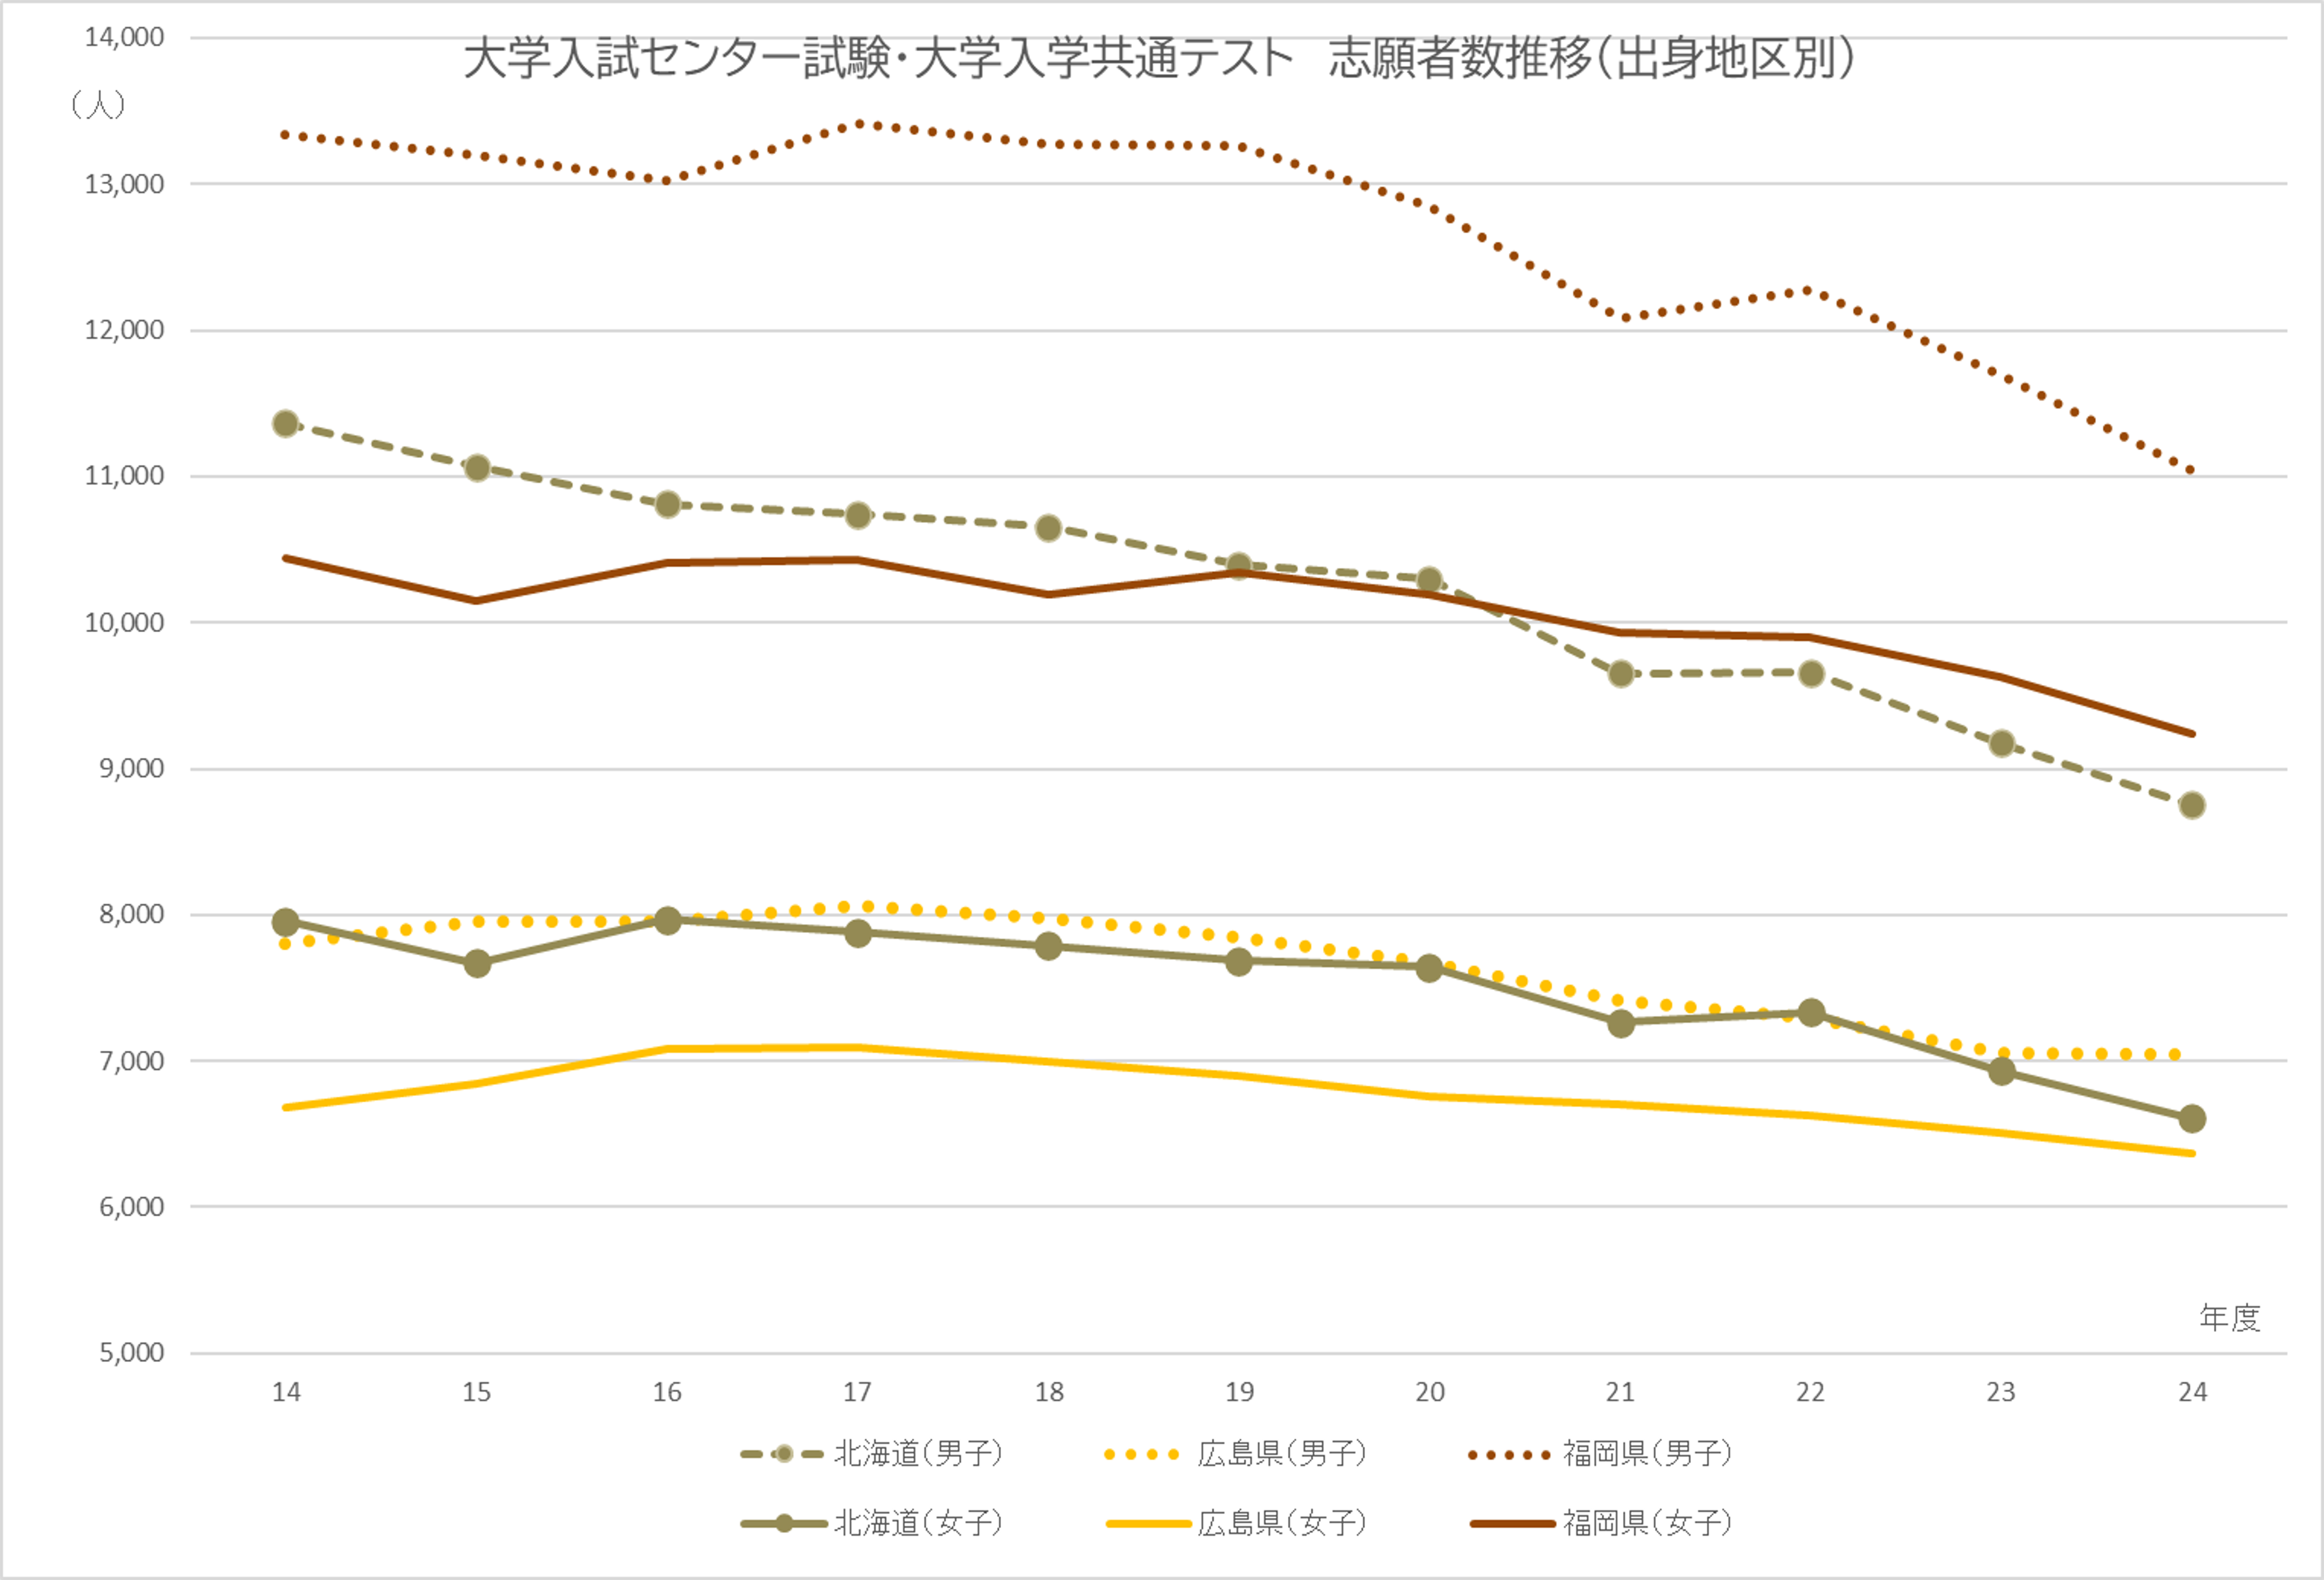
Graph 9,172 shows the trends in the number of applicants in Hokkaido, Hiroshima Prefecture, and Fukuoka Prefecture, which have other major cities.Looking at Graph 7,743, the slope of the graph is steep for both men and women in Hokkaido, Hiroshima, and Fukuoka prefectures, suggesting that university student recruitment is becoming increasingly difficult in these areas.Please note that this graph is based on prefectures with XNUMX or more applicants for the common test, so Kyoto Prefecture (XNUMX people) and Miyagi Prefecture (XNUMX people), which have large cities, are not included.
Just by comparing the current application rate for the common test by prefecture using this material, you can see regional characteristics to some extent, making it an interesting collection of data in many ways (link below).
University Entrance Common Test XNUMX Examination “Number of Applicants, etc.”
https://www.dnc.ac.jp/kyotsu/shiken_jouhou/r6/