On December 12th of last year, the Ministry of Education, Culture, Sports, Science and Technology announced the final school basic statistics (results of the school basic survey) for 20. There are many topics, such as the university (undergraduate) admission rate (including graduates from previous years), which is 5%, the highest ever, but here we will use published figures to show the actual percentage of applicants aiming to enter national and public universities. Let's consider the percentage of examinees who were admitted to national and public universities. The common university entrance test, which is the first barrier to getting into national and public universities, has been implemented, but with about half of private universities having less than their enrollment capacity, will it become easier to get into national and public universities? .

National university admissions by prefecture of high school
The school basic survey contains many materials. Among the tabulations related to "higher educational institutions," there is a tabulation material called "Table No. 16 Enrollment by prefecture of high school" in the category of "School Survey - School Survey Form (University/Graduate School)." Since this is data from a "higher education institution," it is a tally from the university's perspective. The table plots the location of the university (prefecture) on the vertical axis and the location (prefecture) of the high school of those entering the university on the horizontal axis. This allows us to know the number of students from which prefecture's high school and which prefecture's university they are enrolled in.
This table has multiple patterns: ``total'' which is the overall number, ``national'' which shows the number of students enrolled in national universities, ``private'' which shows the number of students enrolled in private universities, and ``total'' which shows the number of males in the ``total.'' There are 4 tables with ``My boys''. Therefore, by subtracting "national" and "private" from the "total", you can calculate the number of students admitted to (assumed) public universities. You can also calculate the total number of girls by subtracting the number of boys from the total. However, just from this table, it is not possible to calculate the breakdown of national universities by male and female, private universities by male and female, etc.
Even so, you can calculate the number of students enrolled in national universities, public universities, and private universities by prefecture, as well as the number of students enrolled in your own prefecture. Here, in addition to the enrollment ratio of national universities, public universities, and private universities for each prefecture, we calculate and compare the enrollment ratio of national and public universities in the prefecture. The enrollment ratio referred to here means the percentage of university admissions calculated using the total number of students from each prefecture as the denominator. It does not indicate the university acceptance rate of examinees in each prefecture, but merely the ratio (%) of those who entered universities in each prefecture to national universities, public universities, and private universities. It doesn't work. However, you can still see some regional characteristics.
Ministry of Education, Culture, Sports, Science and Technology Basic School Survey - FY5 Summary of Results -
Ministry of Education, Culture, Sports, Science and Technology reference page
Akita Prefecture has the highest proportion of national university students, while Shimane Prefecture has the highest proportion of public universities.
According to the Basic School Survey, there will be a total of 2023 students enrolling in universities in 63. Of these, 2,902 students enrolled in national universities, making the ratio of national university enrollments to total university enrollments 9%. The number of students enrolled in private universities is 8,757, so the percentage of students enrolled in private universities is 15.6%. From these numbers, the percentage of students admitted to public universities is 49%. Since these values can be considered as overall average values, we can see that the percentage of those who were able to enter national and public universities among those who entered university was 8,885%, which is approximately 78.8% of the total.
With some exceptions in the Tokyo metropolitan area, traditional preparatory schools often provide school-wide guidance for admission to national and public universities, but from a macro perspective, the hurdles are quite high. It looks like a goal. However, I think it depends on the circumstances of each school. If the school has students in the top 15% of the prefecture, the goal of all students going on to national universities can be said to be a reasonable goal.
Now, is a list of the top 1 students per prefecture, sorted in descending order of enrollment ratios to national, public, and private universities. Akita Prefecture has the highest proportion of students entering national universities, while Shimane Prefecture has the highest proportion of public universities. If you look at the overall average value mentioned above, you can see that this is a very high rate. In terms of regions, Tohoku, Kyushu, Chugoku-Shikoku, and Hokuriku prefectures stand out. Prefectures with a high proportion of students enrolling in public universities have had multiple public universities established in recent years, and some have even converted private universities into public universities. There are also prefectures where each prefecture has one national university and one public university.
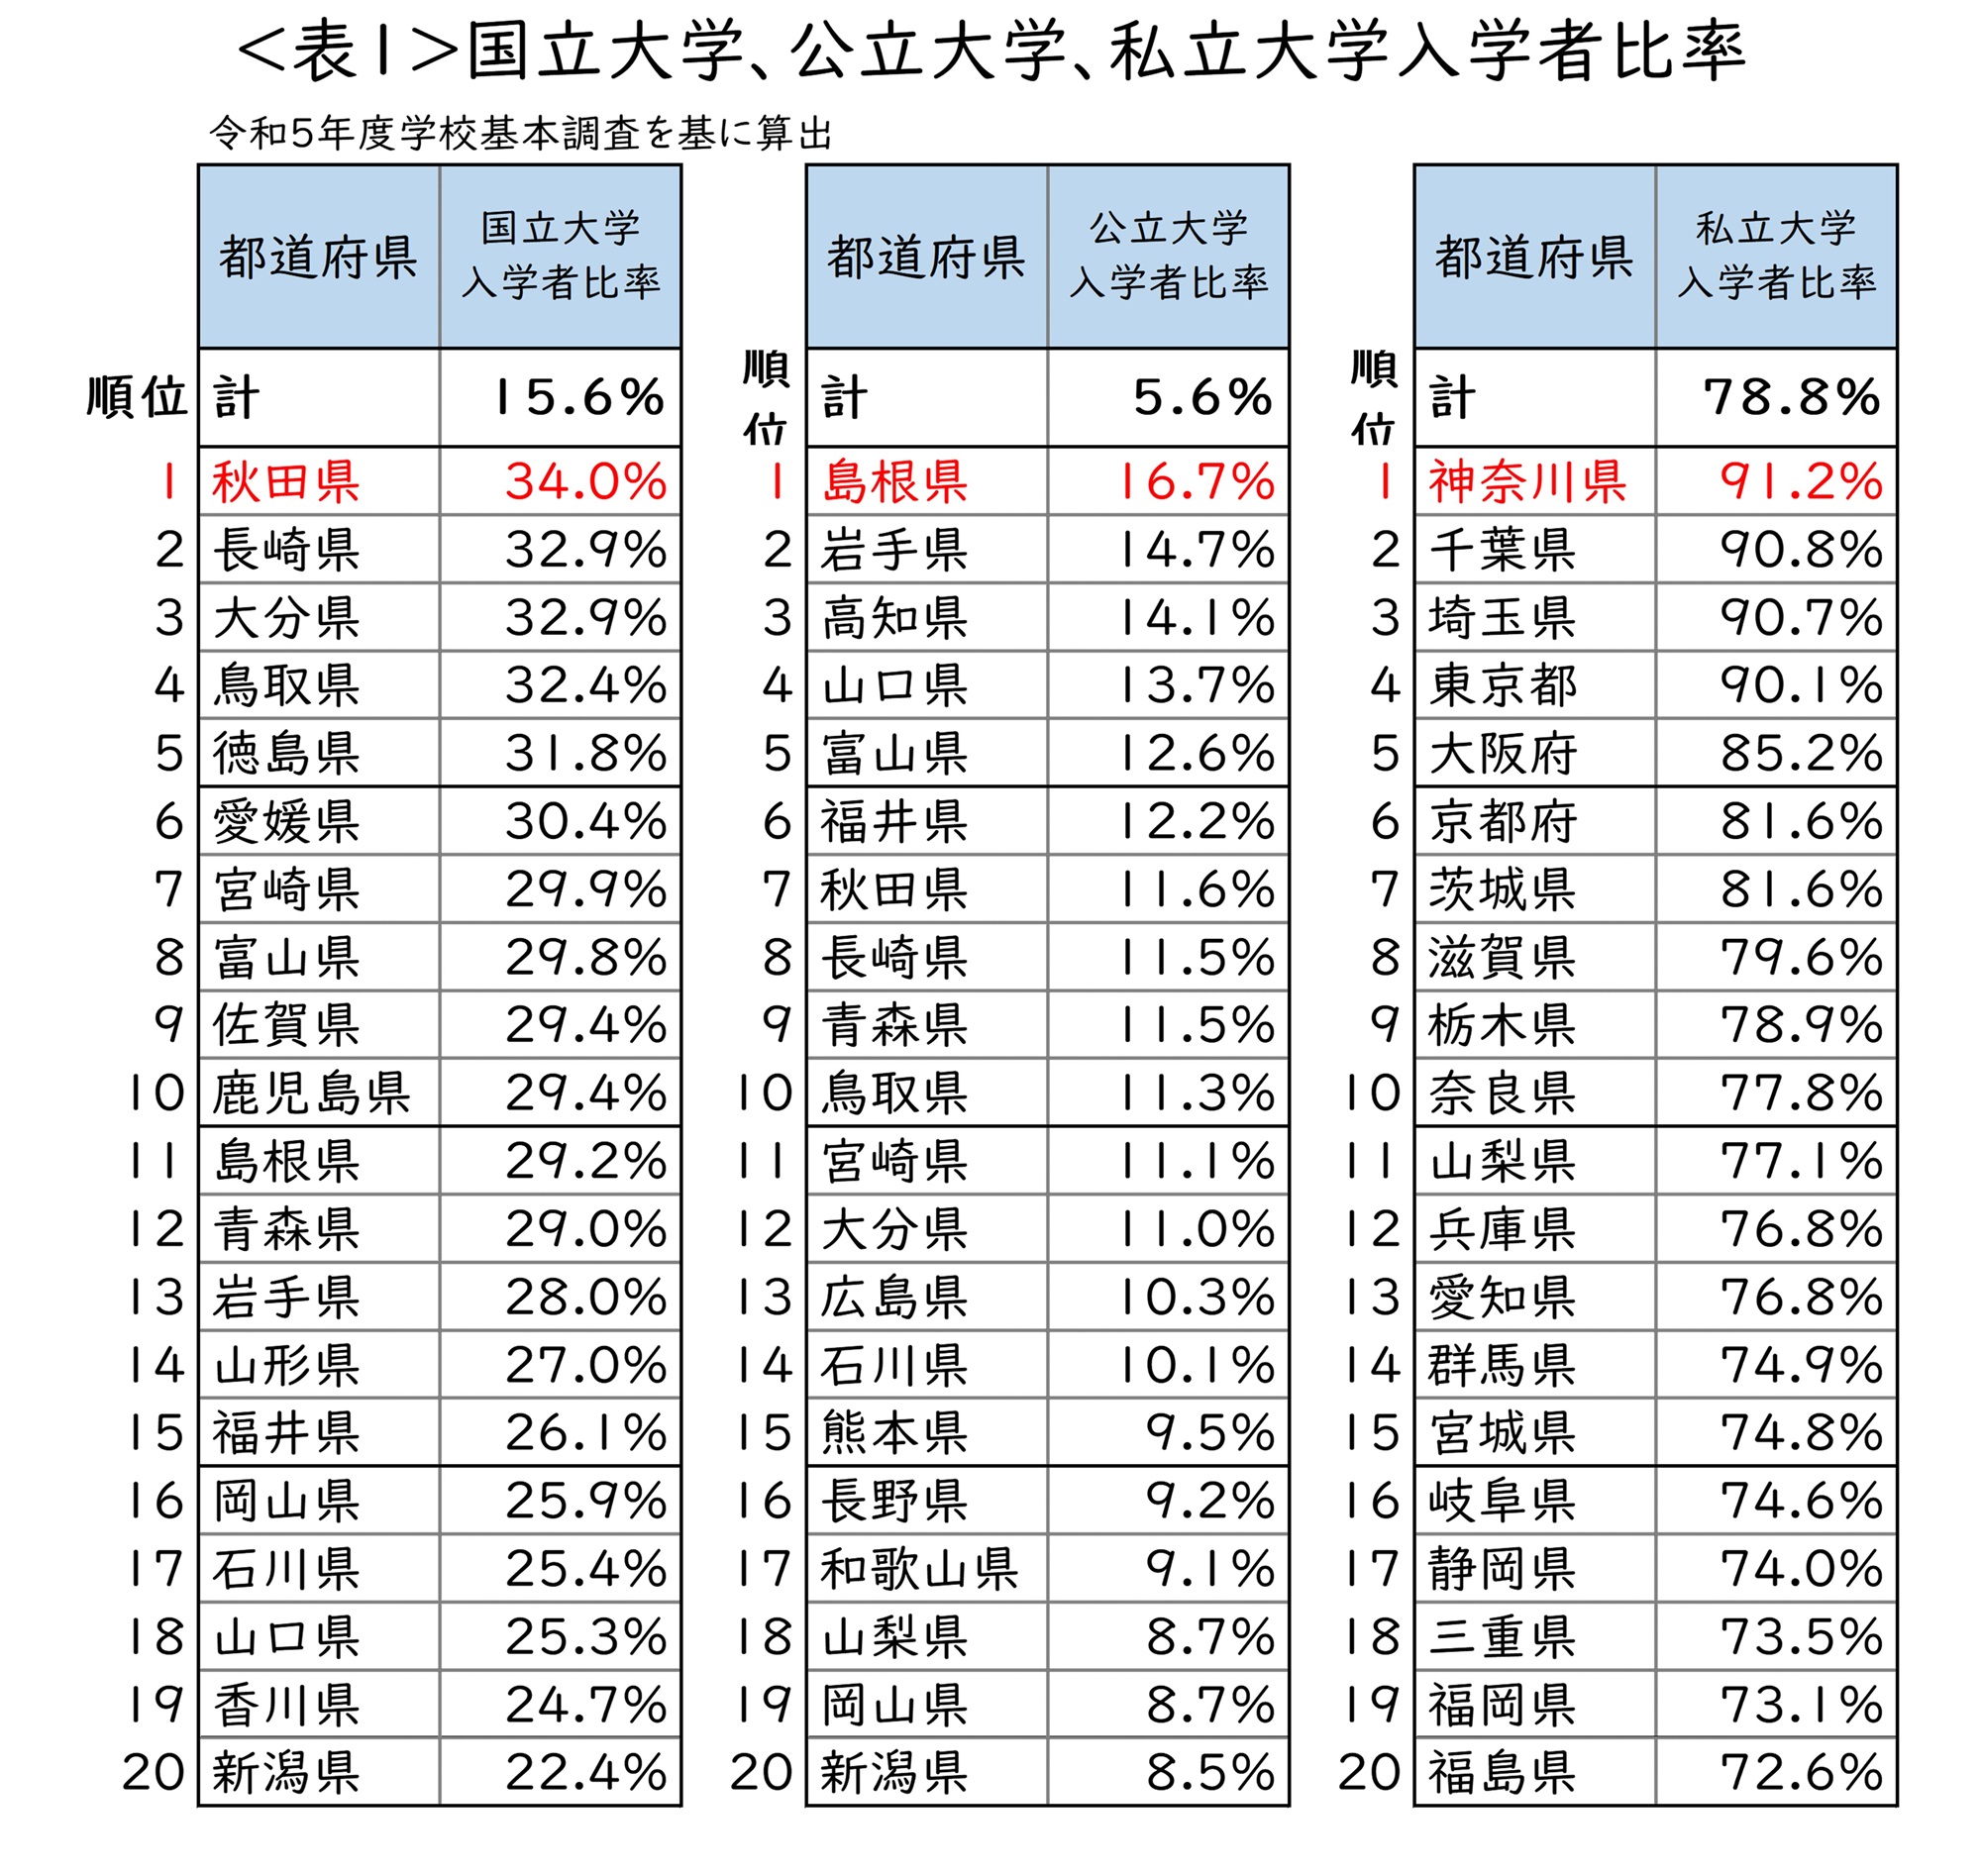
Furthermore, the prefectures with a high proportion of students enrolling in private universities are large cities and areas near large cities. This is a characteristic of urban areas, where many private universities that are popular with prospective students are located within commuting distance from home.
Shimane prefecture and Akita prefecture have the highest percentage of students entering national and public universities, while Hokkaido and Okinawa prefectures have the highest local percentage.
Table 2 shows the ratio of students admitted to national and public universities by adding up national universities and public universities. The composition of each prefecture does not change much, but in Shimane Prefecture, which ranks first, about half of the university admissions are from national and public universities. The same goes for Akita Prefecture, which came in a close second place. In prefectures where the ratio of students admitted to national and public universities exceeds 2%, the expectations of the local community for admission to national and public universities are considered to be quite high, so there is considerable pressure on teachers at preparatory schools in these prefectures. We can infer that (of course, it is the students who are the ones who are really suffering).
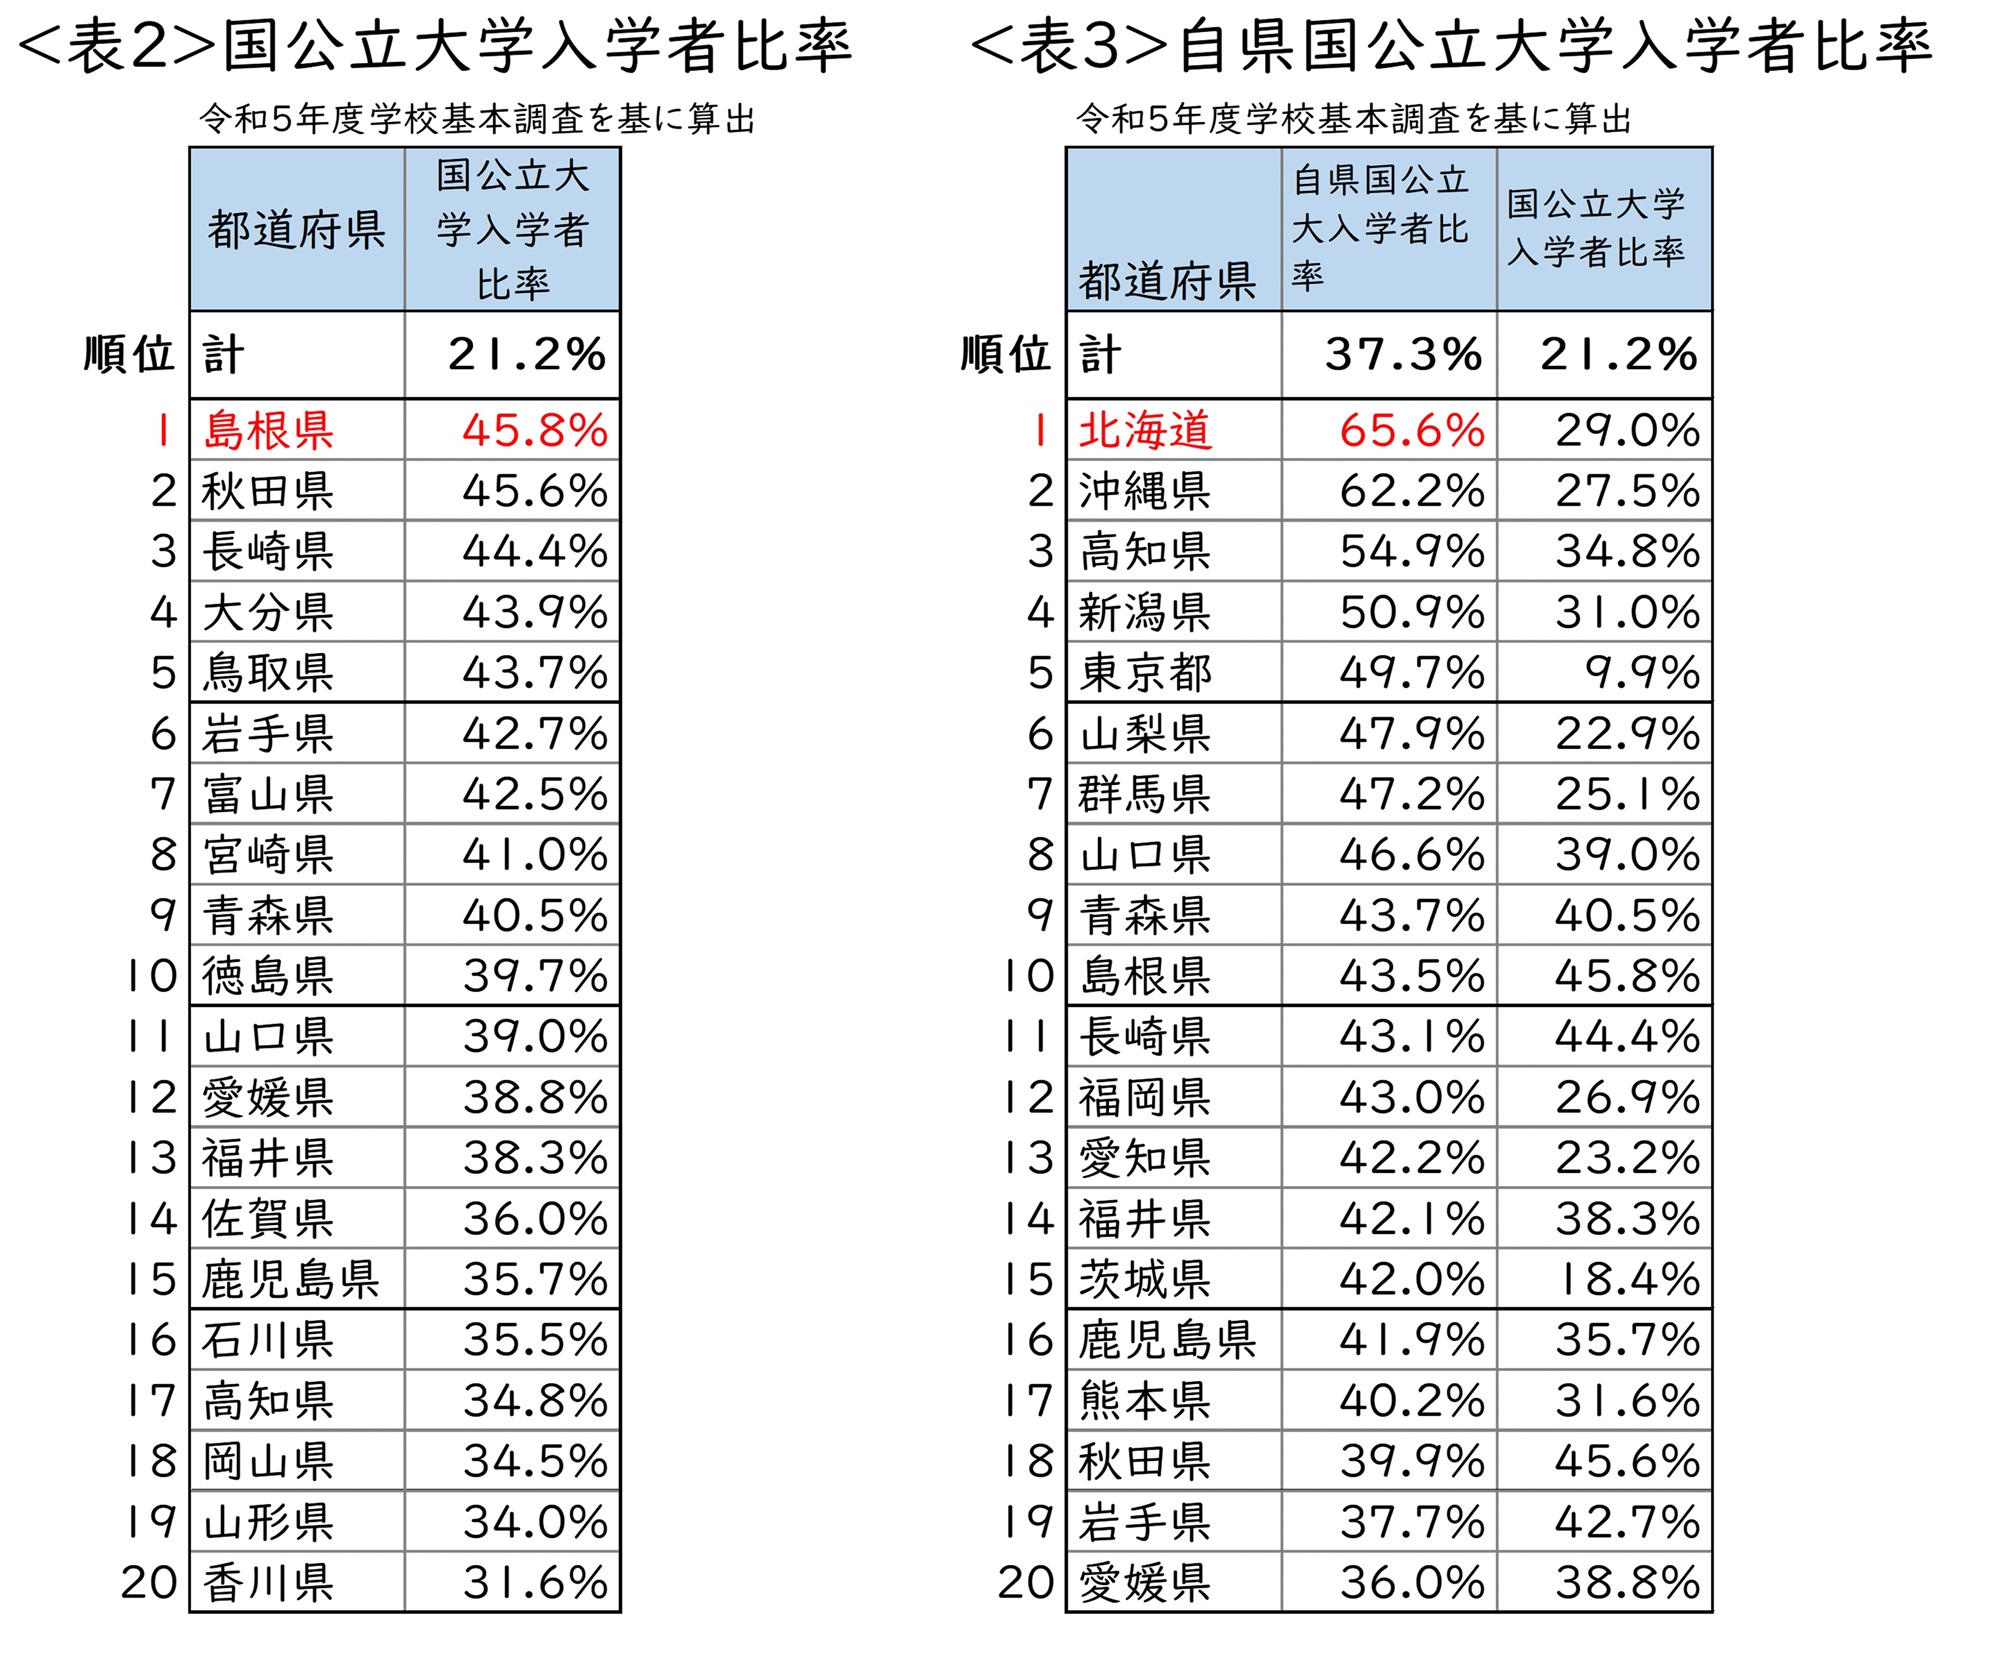
is a list of examinees who entered national and public universities in each prefecture, sorted in descending order of the percentage of students who entered national and public universities located in the same prefecture as their high school (their own prefecture). Conditions such as the number of universities established vary by region, but Hokkaido ranks first, followed by Okinawa Prefecture with a slight difference. Please note that here we treat the university located in your high school as your home prefecture, but depending on your area of residence, it may be easier to commute to another prefecture that is adjacent to your home prefecture, so this does not necessarily refer to the local enrollment rate. However, it is used here to have almost the same meaning as the enrollment rate at local national and public universities. By the way, as I'm sure those in the industry are well aware, there are correspondence high schools with large numbers of students in Hokkaido and Okinawa prefectures. Each school has campuses across the country, but in the school basic survey, Hokkaido and Okinawa prefectures, where our school is located, are considered to be counted as the high school locations of students entering the university. Considering this, the actual local enrollment rate may be higher.
Additionally, the table shows some prefectures that have a high enrollment rate at their own national and public universities, although the enrollment rate at national and public universities is not high. These include Tokyo, Yamanashi Prefecture, Gunma Prefecture, Fukuoka Prefecture, and Aichi Prefecture, but the difference in the numbers in Tokyo is particularly noticeable. These ratios are calculated using different formulas, so it is not accurate to simply compare them, but it is also true that a particular group of examinees account for the majority of admissions to national and public universities located in Tokyo. You can guess.
In addition, based on the results of the 2013 School Basic Survey, we calculated the enrollment rate at national and public universities and found that the overall rate was 21.3%, which is almost the same as this time. The prefectures with the highest enrollment rates were Nagasaki at 48.4%, Shimane at 46.8%, Iwate at 45.5%, Tottori at 44.8%, and Oita at 43.3%, almost the same numbers as this time. Some prefectures have established public universities or converted private universities within the prefecture into public universities (Nagano Prefecture, Yamaguchi Prefecture, etc.), and the enrollment rate at national and public universities has increased. Although it cannot be said to be dramatic, it is fair to say that it had a certain degree of policy effect.
In the future, the admission capacity of national universities will remain almost the same, with exceptions (increased capacity due to support projects to strengthen the functions of universities and technical colleges), but the admission capacity of public universities is expected to increase due to new universities and newly expanded faculties. will be done. If the number of examinees continues to decline, the admission rate to national and public universities should increase based on calculations, but the fact that there has not been a major change overall compared to 10 years ago means that the rate of admission to national and public universities may increase. The core group of people who aim to go on to university may not change in quality or quality in the future.